
Parkinson's Research - Biomarkers, Informatics and Outcomes Visualization
Finding Needles in a Haystack – The Challenge of Big Data
The more we understand about Parkinson’s disease, the more types of data we collect. For the last 15 years, patients visiting our center participate in reporting their personal experience with motor and non-motor symptoms, receive in depth assessments of gait and balance with sophisticated biosensors and consent to blood tests for genetic analysis. This large research database with over 2,500 PD patients and 20,000 office visits includes information on gait and balance, dexterity and tremor, depression and anxiety, as well as sleep and fatigue.
Finding the key inter-relationships and patterns among all this data can be like finding needles in a haystack. To meet this challenge, we are collaborating with data scientists at the University of Maryland at College Park to apply the latest technologic advances to fully capitalize on this valuable data repository. The result of this collaboration is the unique visual data mining tool, BIO-VIS.
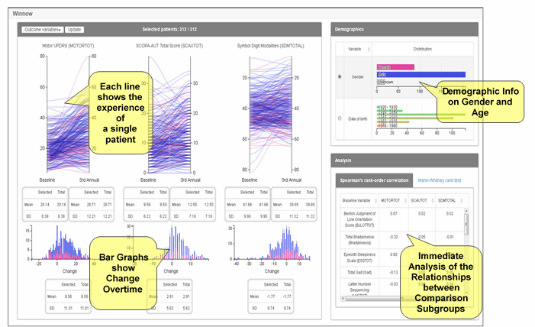
What make BIO-VIS unique? The user simply chooses the data and analyses of interest with a few clicks of the mouse to receive answers to clinical questions in an instant. BIO-VIS is intuitive, interactive and insightful- valuable to both scientist and clinician, and easily adaptable for use with other datasets. BIO-VIS provides the means to hone in on promising hypotheses that justify further investigation. BIO-VIS will increase the value of big data collections by revealing the key patterns and inter-relationships that will move discovery forward.